
pycopykat: a Python implementation of CopyKAT for copy-number inference and aneuploid cell detection from single-cell RNA-seq data
Affiliations
- 1 OmicVerse, Inc., San Francisco, CA 94114, USA
- 2 School of Public Health, Guangzhou Medical University, Guangzhou 511436, China
- 3 Department of Genetics, Stanford University, Stanford, CA 94305, USA
OmicVerse Technical Reports (2026)Cite this article
Download PDFAbstract
We present pycopykat, a Python implementation of CopyKAT, which infers the copy numbers of single cells in 220 kb bins from their expression and calls each cell aneuploid or diploid without reference cells. pycopykat follows CopyKAT's code path, including R's random number generator and gamma draws, R's hierarchical clustering and the mixture models of mixtools, so that the same seed gives the same result as in R. On the six breast tumours of the CopyKAT paper (10,424 cells), pycopykat found the same breakpoints and the same diploid baseline as CopyKAT 1.2.5 and made the same call for every cell; its copy-number matrices agreed with CopyKAT's to 6 × 10⁻¹¹. The known-normal, cell-line and Pearson-distance modes gave the same results as well. pycopykat ran 4.7 to 17 times faster than CopyKAT on one thread. It is used by OmicVerse for copy-number inference and is released at https://github.com/omicverse/py-CopyKAT and on PyPI.
- CopyKAT
- copy-number variation
- aneuploidy
- tumour cells
- single-cell RNA-seq
- Python
- reproducibility
Introduction
Copy-number alterations are present in most tumours and distinguish malignant from normal cells. In single-cell RNA sequencing they leave a trace in expression: the average expression of many neighbouring genes rises with a gain and falls with a loss. Inferring copy number from expression has become a routine way to find the malignant cells and their subclones in tumour atlases1,2. CopyKAT, developed by Gao and colleagues, infers copy numbers in 220 kb bins and calls each cell aneuploid or diploid without reference cells3. It smooths each cell's expression along the genome with a Kalman filter, finds a group of diploid cells by clustering and Gaussian mixture models, segments the genome with a Poisson–gamma model and a Kolmogorov–Smirnov test, and separates aneuploid from diploid cells by hierarchical clustering. Other methods include inferCNV4 and Numbat5.
Single-cell analysis is increasingly done in Python. Workflows are built on scanpy and the scverse ecosystem6,7, and OmicVerse8 brings bulk, single-cell and spatial analyses together in one Python framework. CopyKAT itself is available only in R, as a package on GitHub.
Python users currently reach CopyKAT through rpy29. This requires a parallel R installation, converts the count matrix between the two languages and exposes CopyKAT's options only through the binding layer. A native implementation removes all three costs, as PyDESeq210 has shown for DESeq211 and pyedger12 for edgeR13. We set the same target for pycopykat: an analysis in Python should return the same copy numbers and the same calls as the same analysis in R.
Here we present pycopykat, a Python implementation of CopyKAT that is versioned against a specific CopyKAT release. We describe its implementation and compare it with CopyKAT 1.2.5 on the six breast tumours of the CopyKAT paper.
Implementation
Method
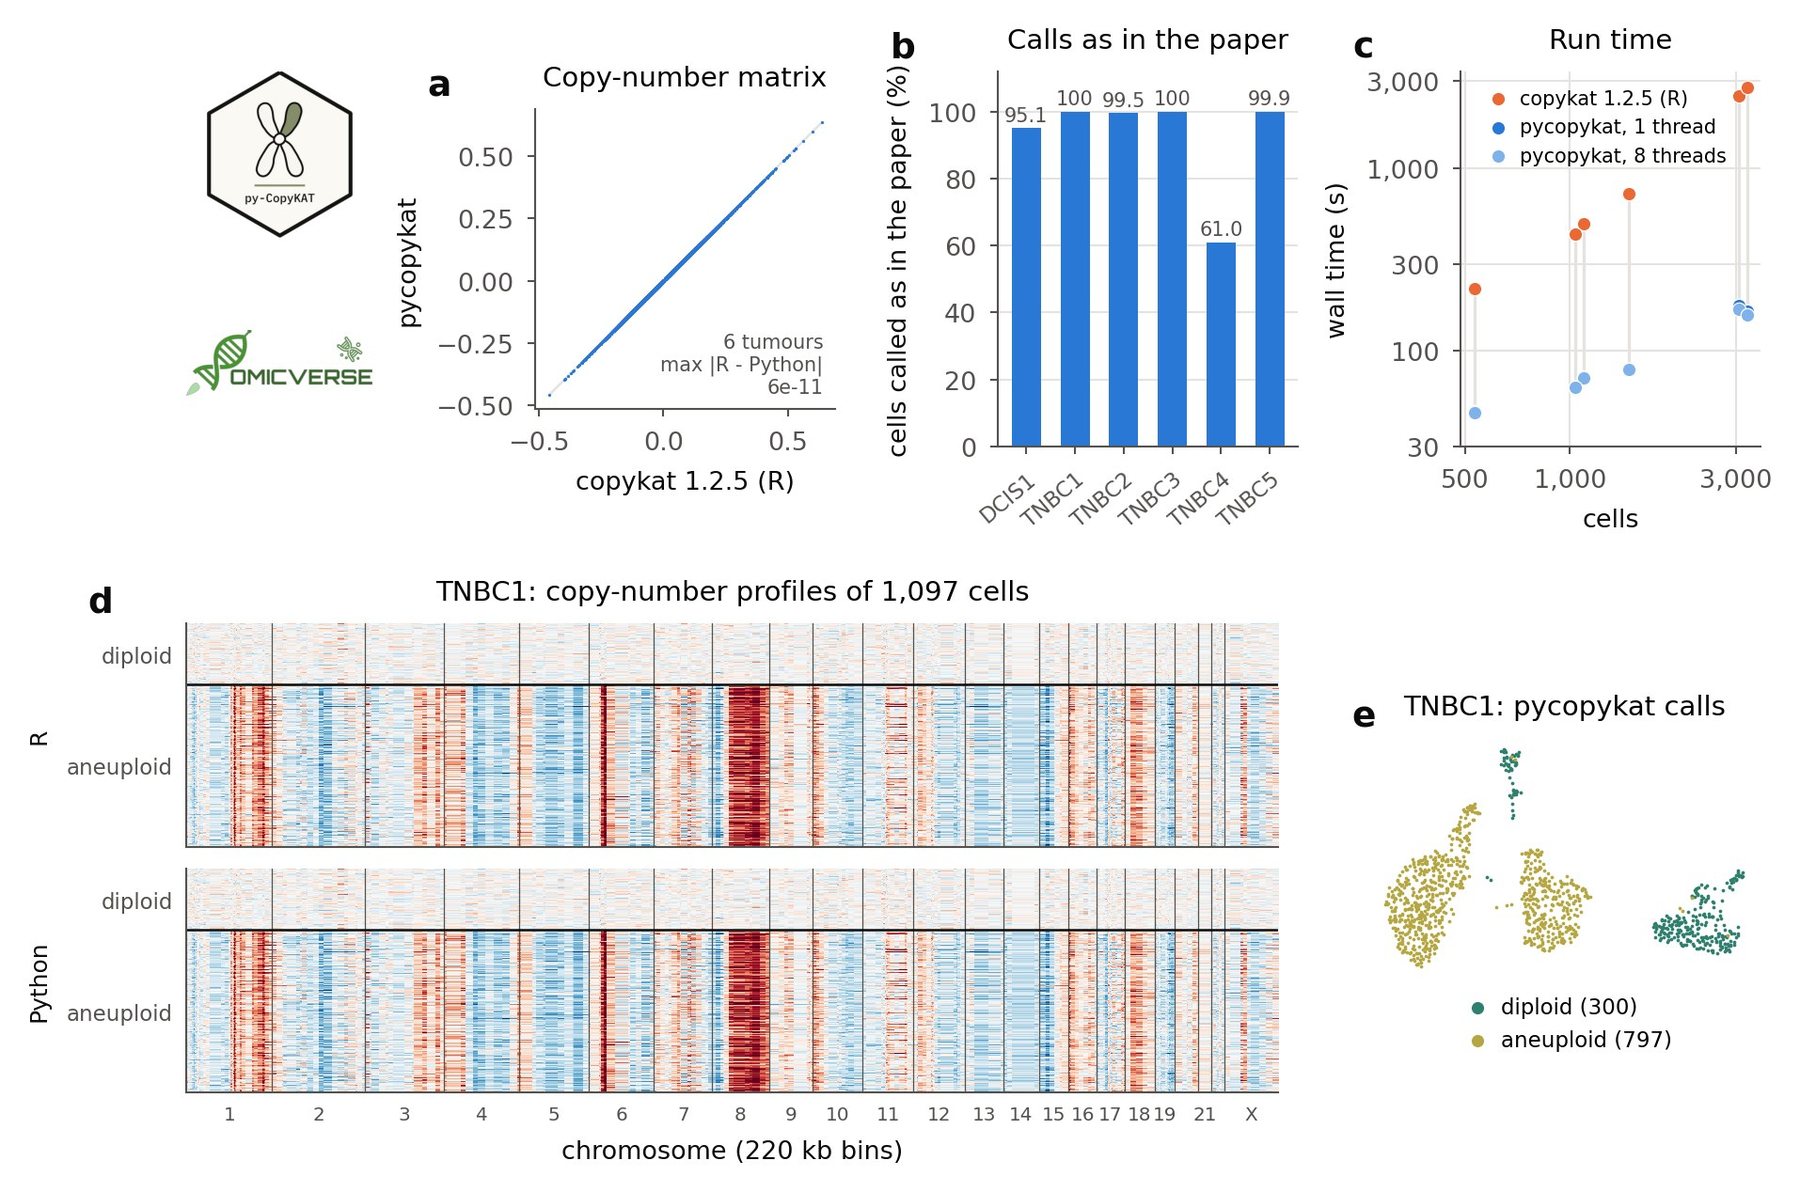
CopyKAT takes the unique molecular identifier counts of a tumour sample3. After removing cells with few detected genes and genes detected in few cells, it places the genes on the genome and removes HLA and cell-cycle genes. It stabilises the variance by $\log(\sqrt{x} + \sqrt{x + 1})$ and smooths each cell along the genome with a local-level Kalman filter (dlm14). To find diploid cells, it clusters the cells with Ward's method15,16 and fits a three-component Gaussian mixture with a common standard deviation to each cluster's median profile (mixtools17). The cluster with the smallest standard deviation becomes the baseline, and the silhouette18 and an F test check the separation; when it is weak, the cells are tested one by one with the same mixture. Breakpoints are found on each cluster's median profile by comparing posterior samples of adjacent 25-gene windows under a Poisson–gamma model (MCMCpack19) with a Kolmogorov–Smirnov test, and every cell receives the posterior mean of each segment. Genes are then summarised into 220 kb bins, and the baseline is re-adjusted on the clusters that hold the diploid cells. The cells are clustered again, and clusters whose consensus profile is closer to the diploid than to the aneuploid one, by the Wasserstein distance, are called diploid (Fig. 1d).
Features and code structure
pycopykat 0.2.0 implements copykat of CopyKAT 1.2.5 (Table 1): the automatic baseline, known normal cells, the cell-line mode, Euclidean, Pearson and Spearman distances, and the human and mouse annotations shipped with CopyKAT. copykat takes a count matrix or an AnnData object20 and returns R's prediction table, the copy-number matrix in 220 kb bins and the cell tree; copykat_by_batch runs it per patient on an AnnData object. pycopykat builds on NumPy21, SciPy22 and pandas23; the Kalman smoother is compiled with Numba24.
| CopyKAT 1.2.5 | pycopykat | Agreement on the benchmark data |
|---|---|---|
| copykat | copykat, CopykatConfig | same call for all 10,424 cells |
| annotateGenes.hg20, annotateGenes.mm10 | core.annotate | same genes in the same order |
| baseline.norm.cl | core.baseline_norm_cl | same clusters and diploid cells |
| baseline.synthetic | core.baseline_synthetic | same copy numbers in the cell-line mode (TNBC3) |
| CNA.MCMC | core.cna_mcmc | same breakpoints (219–326 per tumour) |
| convert.all.bins.hg20 | core.convert_bins_hg20 | copy numbers within $6 \times 10^{-11}$ |
Numerical parity with CopyKAT
pycopykat follows the code that CopyKAT runs, in R's order of genes and cells. CopyKAT draws random numbers only in the segmentation, where each window and each segment of each cell takes 1,000 gamma draws from R's generator after set.seed(1234). pycopykat ports R's Mersenne-Twister generator25 and R's gamma generator, the GD algorithm of Ahrens and Dieter26 with its exponential and normal draws. A draw uses a variable number of uniforms, so pycopykat produces the draws in vectorised form. It evaluates the length of a draw at every position of a stretch of the random stream, follows the chain of draws through it and corrects the few draws whose length depends on the gamma shape; every draw equals R's. R's hierarchical clustering and tree cutting are ported from R's Fortran and C code, including the order of ties and the numbering of clusters, and the mixture model from mixtools' C routine, so that it stops after the same number of iterations. dlm's Kalman filter works on singular value decompositions, which shifts the first genes of each cell by about $10^{-10}$ relative to the plain recursions that pycopykat uses. The steps are tested against CopyKAT 1.2.5 (55 tests, of which 5 compare with stored R results on CopyKAT's example data and 9 with stored R values of the generators, the clustering and the mixture model). pycopykat versions follow CopyKAT releases (0.2.x tracks CopyKAT 1.2.5).
Use in OmicVerse
pycopykat is the CopyKAT backend of OmicVerse8 copy-number inference: ov.single.CNV(adata, method='copykat'), whose run method stores the copy-number matrix, the call of each cell and a per-cell score in the AnnData object.
Comparison with CopyKAT
Data and design
We used the six breast tumours of the CopyKAT paper, a ductal carcinoma in situ and five triple-negative breast cancers profiled with 10x Genomics3 (532 to 3,225 cells per tumour, 10,424 in total), with the tumour or normal call that the paper gave each cell. Both packages ran CopyKAT with its defaults on the counts (Supplementary methods). We compared the breakpoints, the diploid cells of the baseline, the calls, the copy-number matrices and run time; the known-normal, cell-line and Pearson-distance modes were compared on TNBC3.
Copy numbers and calls
pycopykat found the same breakpoints as CopyKAT in every tumour, 219 to 326 per tumour, the same diploid cells for the baseline and the same call for all 10,424 cells. The copy-number matrices agreed to a largest absolute difference of $6 \times 10^{-11}$ (Fig. 1a, d). On TNBC3, the known-normal, cell-line and Pearson-distance modes gave the same breakpoints and cell trees, and the known-normal and Pearson-distance modes the same calls; the cell-line mode makes no calls.
Against the calls published with the data, both packages agreed on 95.1 to 100.0% of the cells in five tumours (Fig. 1b, e). In TNBC4, CopyKAT 1.2.5 and pycopykat called all 3,055 cells diploid, where the paper called 1,192 tumour cells: the consensus profiles of the diploid and aneuploid clusters correlated with $r = 0.70$, above the threshold of 0.6 at which CopyKAT 1.2 calls a sample diploid.
Speed
pycopykat ran 4.7 to 17 times faster than CopyKAT on one thread (Fig. 1c). For TNBC5, the largest tumour (3,225 cells), CopyKAT took 2,759 s and pycopykat 165 s; most of pycopykat's time is spent on the gamma draws of the segmentation, which follow one sequential random stream, so eight threads took 157 s.
Conclusion and future perspectives
pycopykat brings CopyKAT to Python with the same results as R. From the same seed, it reproduces CopyKAT 1.2.5's breakpoints, diploid baseline and calls in every tumour tested, with copy-number matrices that agree to $6 \times 10^{-11}$, while running several times faster. Because pycopykat works with AnnData objects and is part of OmicVerse, copy-number inference and the identification of malignant cells can be done in the same Python session as the rest of a single-cell workflow.
Future work includes CopyKAT's earth mover's distance clustering (test.emd), its segment files for IGV and its heatmaps, and a parallel random stream for the segmentation. pycopykat will continue to follow CopyKAT releases, with each version pinned to the release it reproduces.
Data and code availability
pycopykat is released under the GNU General Public License (version 2 or later) on PyPI (pip install pycopykat) and at https://github.com/omicverse/py-CopyKAT; this report describes version 0.2.0. The benchmark (report/scripts in the repository) reproduces every number and figure in this report. The count matrices of the six breast tumours with the calls of the CopyKAT paper were obtained from the Gene Expression Omnibus (GSE148673: DCIS1 and TNBC1 to TNBC5), accessed on 13 November 2026. Software: pycopykat 0.2.0 (Python 3.10, NumPy 2.2.6, SciPy 1.15.2, pandas 2.3.3, Numba 0.67.0; scanpy 1.11.5 for Fig. 1e); CopyKAT 1.2.5 with dlm 1.1.6.1, MCMCpack 1.7.1, mixtools 2.0.0.1, parallelDist 0.2.7 and transport 0.15.4 on R 4.5.3 (conda-forge). Hardware: one node of the Stanford Sherlock cluster (AMD EPYC 9754).
Declaration of generative AI and AI-assisted technologies
The authors used Claude Opus 5.5, GPT-6 Astra, and OmicOS to proofread grammar and syntax, improve readability. Any AI-assisted edits were reviewed by the authors, who take full responsibility for the content of this publication.
Conflicts of interest
Contributors Jieshen Xian and Zehua Zeng are affiliated with OmicVerse, Inc.
References
- 1.Patel AP, Tirosh I, Trombetta JJ, et al. (2014). Single-cell RNA-seq highlights intratumoral heterogeneity in primary glioblastoma. Science 344, 1396-1401. 10.1126/science.1254257
- 2.Tirosh I, Izar B, Prakadan SM, et al. (2016). Dissecting the multicellular ecosystem of metastatic melanoma by single-cell RNA-seq. Science 352, 189-196. 10.1126/science.aad0501
- 3.Gao R, Bai S, Henderson YC, et al. (2021). Delineating copy number and clonal substructure in human tumors from single-cell transcriptomes. Nature Biotechnology 39, 599-608. 10.1038/s41587-020-00795-2
- 4.Tickle T, Tirosh I, Georgescu C, Brown M, Haas B. inferCNV of the Trinity CTAT Project. Klarman Cell Observatory, Broad Institute. https://github.com/broadinstitute/inferCNV
- 5.Gao T, Soldatov R, Sarkar H, et al. (2023). Haplotype-aware analysis of somatic copy number variations from single-cell transcriptomes. Nature Biotechnology 41, 417-426. 10.1038/s41587-022-01468-y
- 6.Wolf FA, Angerer P, Theis FJ (2018). SCANPY: large-scale single-cell gene expression data analysis. Genome Biology 19, 15. 10.1186/s13059-017-1382-0
- 7.Virshup I, Bredikhin D, Heumos L, et al. (2023). The scverse project provides a computational ecosystem for single-cell omics data analysis. Nature Biotechnology 41, 604-606. 10.1038/s41587-023-01733-8
- 8.Zeng Z, Ma Y, Hu L, et al. (2024). OmicVerse: a framework for bridging and deepening insights across bulk and single-cell sequencing. Nature Communications 15, 5983. 10.1038/s41467-024-50194-3
- 9.Gautier L. rpy2: Python interface to the R language. https://rpy2.github.io
- 10.Muzellec B, Teleńczuk M, Cabeli V, Andreux M (2023). PyDESeq2: a python package for bulk RNA-seq differential expression analysis. Bioinformatics 39, btad547. 10.1093/bioinformatics/btad547
- 11.Love MI, Huber W, Anders S (2014). Moderated estimation of fold change and dispersion for RNA-seq data with DESeq2. Genome Biology 15, 550. 10.1186/s13059-014-0550-8
- 12.Zeng Z, Meng X (2026). pyedger: a Python implementation of edgeR for differential expression analysis. Preprints.org. 10.20944/preprints202611.1133.v1
- 13.Robinson MD, McCarthy DJ, Smyth GK (2010). edgeR: a Bioconductor package for differential expression analysis of digital gene expression data. Bioinformatics 26, 139-140. 10.1093/bioinformatics/btp616
- 14.Petris G (2010). An R package for dynamic linear models. Journal of Statistical Software 36, 1-16. 10.18637/jss.v036.i12
- 15.Ward JH (1963). Hierarchical grouping to optimize an objective function. Journal of the American Statistical Association 58, 236-244. 10.1080/01621459.1963.10500845
- 16.Murtagh F, Legendre P (2014). Ward's hierarchical agglomerative clustering method: which algorithms implement Ward's criterion? Journal of Classification 31, 274-295. 10.1007/s00357-014-9161-z
- 17.Benaglia T, Chauveau D, Hunter DR, Young DS (2009). mixtools: an R package for analyzing finite mixture models. Journal of Statistical Software 32, 1-29. 10.18637/jss.v032.i06
- 18.Rousseeuw PJ (1987). Silhouettes: a graphical aid to the interpretation and validation of cluster analysis. Journal of Computational and Applied Mathematics 20, 53-65. 10.1016/0377-0427(87)90125-7
- 19.Martin AD, Quinn KM, Park JH (2011). MCMCpack: Markov chain Monte Carlo in R. Journal of Statistical Software 42, 1-21. 10.18637/jss.v042.i09
- 20.Virshup I, Rybakov S, Theis FJ, Angerer P, Wolf FA (2024). anndata: access and store annotated data matrices. Journal of Open Source Software 9, 4371. 10.21105/joss.04371
- 21.Harris CR, Millman KJ, van der Walt SJ, et al. (2020). Array programming with NumPy. Nature 585, 357-362. 10.1038/s41586-020-2649-2
- 22.Virtanen P, Gommers R, Oliphant TE, et al. (2020). SciPy 1.0: fundamental algorithms for scientific computing in Python. Nature Methods 17, 261-272. 10.1038/s41592-019-0686-2
- 23.McKinney W (2010). Data structures for statistical computing in Python. Proceedings of the 9th Python in Science Conference, 56-61. 10.25080/Majora-92bf1922-00a
- 24.Lam SK, Pitrou A, Seibert S (2015). Numba: a LLVM-based Python JIT compiler. Proceedings of the Second Workshop on the LLVM Compiler Infrastructure in HPC, 1-6. 10.1145/2833157.2833162
- 25.Matsumoto M, Nishimura T (1998). Mersenne twister: a 623-dimensionally equidistributed uniform pseudo-random number generator. ACM Transactions on Modeling and Computer Simulation 8, 3-30. 10.1145/272991.272995
- 26.Ahrens JH, Dieter U (1982). Generating gamma variates by a modified rejection technique. Communications of the ACM 25, 47-54. 10.1145/358315.358390
- 27.Becht E, McInnes L, Healy J, et al. (2019). Dimensionality reduction for visualizing single-cell data using UMAP. Nature Biotechnology 37, 38-44. 10.1038/nbt.4314
Supplementary information
Supplementary methods
Data. The count matrices of GSE148673 (DCIS1 and TNBC1 to TNBC5) were read with all their genes and with the call that the CopyKAT paper gives each cell (tumour or normal); the paper's calls served only for comparison.
Runs. In R: copykat(rawmat, id.type = "S", ngene.chr = 5, win.size = 25, KS.cut = 0.1, distance = "euclidean", norm.cell.names = "", genome = "hg20", n.cores = 1), which sets set.seed(1234); everything else at its defaults. In Python: pycopykat.copykat with the same arguments (CopykatConfig() defaults, seed = 1234). The other modes on TNBC3 used the paper's normal cells as norm.cell.names, cell.line = "yes" or distance = "pearson". CopyKAT runs with n.cores = 1 because its parallel workers start from unseeded random generators.
Comparison. Breakpoints, the diploid cells of the baseline and the calls were compared for equality; the copy-number matrices (the returned CNAmat, 12,167 bins) entry by entry. Agreement with the paper's calls counts cells called aneuploid where the paper called them tumour and diploid where it called them normal, over the cells that CopyKAT keeps.
Embedding (Fig. 1e). The cells of TNBC1 were embedded with scanpy (counts normalised to 10,000 per cell and log-transformed, 2,000 variable genes, 30 principal components, 15 nearest neighbours) and UMAP; the embedding is for display only.
Run time. Run times are wall-clock times of copykat, without reading and writing files. Each run was pinned to idle processor cores, one core for CopyKAT and for pycopykat on one thread (BLAS and OpenMP limited to one thread) and eight for pycopykat on eight threads. Each tumour ran twice per configuration, and the faster run is reported.
Notes for users coming from R
- pycopykat 0.2.x follows CopyKAT 1.2.5, including its defaults;
CopykatConfigtakes R's arguments with Python names (LOW.DRislow_dr,KS.cutisks_cut,norm.cell.namesisnorm_cell_names). - The prediction table has R's columns
cell.namesandcopykat.pred; the copy-number matrix is indexed by R'schrom,chromposandabspos. - Results equal R's with
n.cores = 1;n_jobsin pycopykat sets threads and does not change the results. - The cell tree is returned in R's
hclustform (merge,height,order, 1-based).
Author information
Affiliations
- 1 OmicVerse, Inc., San Francisco, CA 94114, USA
- 2 School of Public Health, Guangzhou Medical University, Guangzhou 511436, China
- 3 Department of Genetics, Stanford University, Stanford, CA 94305, USA
Correspondence
Correspondence to OmicVerse Team (contact@omicos.cn).
Contributors
OmicVerse Team members who contributed to this report: Jieshen Xian1,2, Zehua Zeng1,3.
Cite this article
OmicVerse Team. pycopykat: a Python implementation of CopyKAT for copy-number inference and aneuploid cell detection from single-cell RNA-seq data. OmicVerse Technical Reports (2026). https://omicverse.org/articles/pycopykat
@techreport{omicverseteam2026pycopykat,
  title       = {pycopykat: a Python implementation of CopyKAT for copy-number inference and aneuploid cell detection from single-cell RNA-seq data},
  author      = {{OmicVerse Team}},
  institution = {OmicVerse},
  type        = {Technical Report},
  year        = {2026},
  url         = {https://omicverse.org/articles/pycopykat}
}