
pysccdc: a Python implementation of scCDC for gene-specific ambient RNA correction in single-cell RNA-seq data
Affiliations
- 1 Department of Genetics, Stanford University, Stanford, CA 94305, USA
- 2 OmicVerse, Inc., San Francisco, CA 94114, USA
- 3 Hubei Key Laboratory of Agricultural Bioinformatics, College of Informatics, Huazhong Agricultural University, Wuhan 430070, China
OmicVerse Technical Reports (2026)Cite this article
Download PDFAbstract
We present pysccdc, a Python implementation of scCDC, which detects the genes that contaminate droplet-based single-cell and single-nucleus RNA-seq data from the entropy of their counts within cell clusters and corrects only those genes. pysccdc ports the code path of scCDC, including R's random number generator and sampling, R's smoothing spline and the ROC analysis used to set each gene's correction, so that it returns R's result. On four human–mouse mixtures from 10x Genomics (26,038 cells), pysccdc detected the same 18 to 102 contaminating genes as scCDC 1.4, in the same order, and returned identical corrected counts. It ran 11 to 50 times faster than scCDC on one thread. pysccdc is used by OmicVerse for ambient RNA correction and is released at https://github.com/omicverse/py-sccdc and on PyPI.
- scCDC
- ambient RNA
- contamination
- entropy
- single-cell RNA-seq
- Python
- reproducibility
Introduction
Droplet-based single-cell RNA sequencing captures, together with each cell, cell-free RNA from the suspension. These ambient transcripts add counts of genes a cell does not express, blur cell-type markers and can mislead clustering and differential expression, so the correction of ambient RNA is a routine quality-control step1,2. Most methods correct every gene of every cell: SoupX3 subtracts an ambient profile estimated from empty droplets, decontX4 models each cell as a mixture of its population's expression and contamination, and CellBender5 fits a generative model to all droplets. FastCAR6 corrects the genes that are frequent in empty droplets. scCDC7 corrects only the genes that it detects as contaminating from the cells themselves, without empty droplets. A gene that leaks into all cells has, within a cluster, counts that vary less than those of a gene expressed at the same level, and therefore a lower entropy.
Single-cell analysis is increasingly done in Python. Workflows are built on scanpy and the scverse ecosystem8,9, and OmicVerse10 brings bulk, single-cell and spatial analyses together in one Python framework. scCDC, however, is available only in R, as a package on GitHub that builds on Seurat.
Python users currently reach scCDC through rpy211. This requires a parallel R installation with Seurat, converts the count matrix between the two languages and exposes scCDC's functions only through the binding layer. A native implementation removes all three costs, as PyDESeq212 has shown for DESeq213 and pyedger14 for edgeR15. We set the same target for pysccdc: a correction in Python should return the same contaminating genes and the same counts as the same correction in R.
Here we present pysccdc, a Python implementation of scCDC that is versioned against a specific scCDC release. We describe its implementation and compare it with scCDC 1.4 on human–mouse mixtures from 10x Genomics, in which the ambient RNA of every cell can be measured directly.
Implementation
Method
scCDC takes the counts and a clustering of the cells7. In each cluster of at least 100 cells, it computes for every gene the Shannon entropy16 of the distribution of its counts across the cells and the logarithm of its mean count. It fits the expected entropy as a function of expression with a smoothing spline: ten times, on 80% of the genes drawn at random, each time removing twice the genes far below the curve before the final fit, and averaging the ten curves. The entropy divergence of a gene is its expected minus its observed entropy; a one-sided normal p-value and the false discovery rate of Benjamini and Hochberg17 call genes with a divergence that is too large. Genes called in at least half of the clusters and detected in at least 20% of the cells of every cluster are the global contamination-causing genes (GCGs). For each GCG, scCDC orders the clusters by their average expression in Seurat18 and takes the lowest of the clusters with at least 50 cells as a reference. Clusters whose cells separate from the reference with an area under the ROC curve19 of at least 0.9 express the gene. The count that best separates the cells of the other clusters from those of the lowest of the expressing clusters, by the Youden index20, is subtracted from the gene's count in every cell, with a floor at zero. All other genes are left unchanged.
Features and code structure
pysccdc 0.1.1 implements the functions of scCDC 1.4 (Table 1): detection, correction and the dataset-level contamination ratio. The functions take AnnData objects21 with the counts and a cluster column, and the corrected counts are stored in a layer. pysccdc builds on NumPy22, SciPy23 and pandas24 and keeps the counts sparse throughout.
| scCDC 1.4 | pysccdc | Agreement on the benchmark data |
|---|---|---|
| ContaminationDetection | ContaminationDetection | same GCGs in the same order |
| ContaminationCorrection | ContaminationCorrection | identical corrected counts |
| ContaminationQuantification | ContaminationQuantification | identical ratio on the test data |
| MatrixToEntropy | matrix_entropy | identical entropies |
| smooth.spline (stats) | SmoothSpline | identical curves |
Numerical parity with scCDC
The bootstrap of the curve fit draws genes with R's sample, so pysccdc ports R's Mersenne-Twister generator25 and its rejection sampling. R does not take this seed from the user: before fitting the curves scCDC subsets the Seurat object, and Seurat's subset sets the seed to 1. pysccdc therefore draws from that seed by default. The spline follows R's smooth.spline step by step, from the pooling of tied values and the choice of knots to the banded Cholesky solve and the evaluation of the curve, with linear extrapolation outside the data. Means, standard deviations and row means accumulate in extended precision as in R, the normal distribution function follows Cody's algorithm26, and logarithms come from the C library. The ROC analysis follows pROC19, and the clusters are ordered by Seurat's average of the exponentiated normalised data. The steps are tested against scCDC 1.4 (21 tests, of which 7 run R and 3 use stored R values). pysccdc versions follow scCDC releases (0.1.x tracks scCDC 1.4).
Use in OmicVerse
pysccdc is the scCDC backend of OmicVerse10 ambient-RNA correction: ov.pp.ambient.remove_ambient(adata, method='sccdc', cluster_key=...) runs detection and correction on a filtered, clustered AnnData and stores the GCGs, the contamination ratio and the corrected counts.
Comparison with scCDC on human–mouse mixtures
Data and design
We used the mixtures of human and mouse cells from 10x Genomics27 of the pysoupx report3, with Cell Ranger's cells and one clustering given to both packages. In a human cell, counts of mouse genes can only come from ambient RNA, and the reverse holds for mouse cells (Supplementary methods). Both packages kept the genes with counts in at least three cells, as Seurat does by default, and ran detection and correction with their defaults. scCDC requires that fewer than three quarters of the genes have no counts in each analysed cluster. In hgmm 10k one small cluster did not meet this, and both packages stopped at the same step; the comparison uses the other four mixtures, hgmm 1k and 5k with v3 chemistry and 6k and 12k with v2 (1,046 to 12,820 cells, 26,038 in total). We compared the GCGs, their entropy divergences and the corrected counts, how much ambient RNA the correction removed, and run time.
Contaminating genes and corrected counts
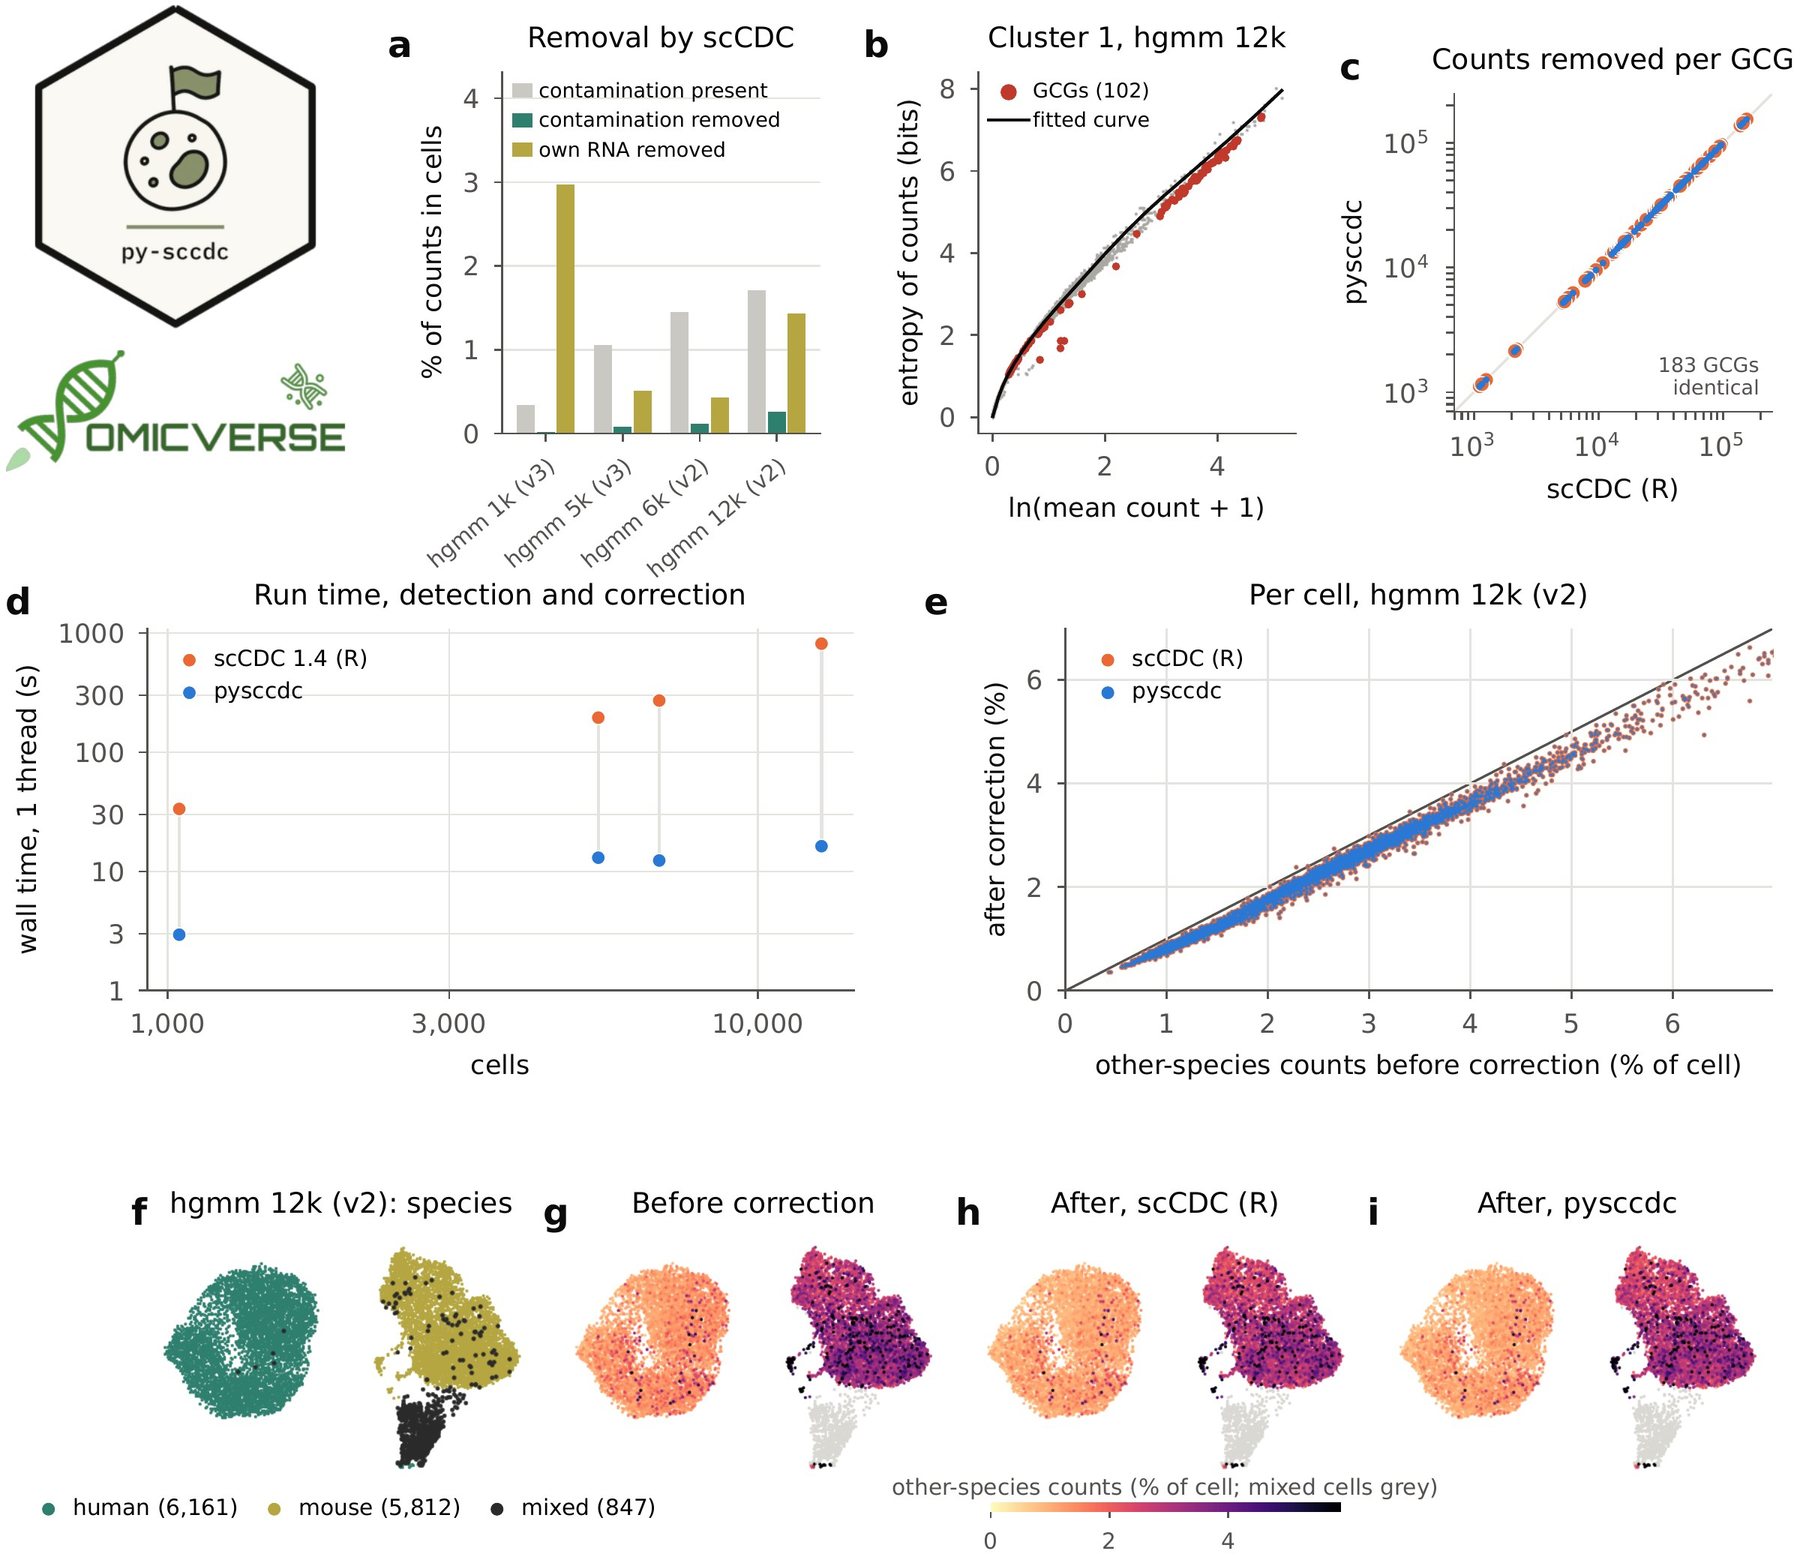
pysccdc detected the same GCGs as scCDC in all four mixtures, from 18 in hgmm 1k to 102 in hgmm 12k, in the same order (Table 1). The counts removed from each of the 183 GCGs were the same (Fig. 1c), and the corrected count matrices were identical in every entry, with a largest absolute difference of 0. The entropy divergences agreed to $3 \times 10^{-11}$; R's linear algebra library computes the spline with fused multiply–add instructions, and with these disabled the divergences of hgmm 1k were identical to the last bit. In the embedding of hgmm 12k, the share of other-species counts after correction was the same in every cell (Fig. 1e–i).
Both packages therefore correct the mixtures in the same way. The GCGs had a lower entropy than the curve predicted for their expression (Fig. 1b), and the correction removed 5.7 to 15.0% of the cross-species counts, which made up 0.3 to 1.7% of the counts of the cells. Because the same count is subtracted from every cell, cells that express a GCG lose counts as well: 0.44 to 2.99% of the counts of the cell's own species were removed (Fig. 1a). In hgmm 1k, where cross-species counts were 0.3% of all counts, the correction removed 5.7% of them and 2.99% of the own-species counts.
Speed
pysccdc ran 11 to 50 times faster than scCDC (Fig. 1d). For hgmm 12k, the largest mixture (12,820 cells), detection and correction took 813 s with scCDC and 16 s with pysccdc.
Conclusion and future perspectives
pysccdc brings scCDC to Python with the same results as R. On four human–mouse mixtures it detects the same contaminating genes as scCDC 1.4, from the same random draws, returns identical corrected counts and runs one to two orders of magnitude faster. Because pysccdc works with AnnData objects and is part of OmicVerse, ambient RNA can be corrected in the same Python session as the rest of a single-cell workflow. scCDC's gene-specific correction can also be compared directly with the corrections of pysoupx, pydecontx and pyfastcar on the same data.
Future work includes scCDC's plots of the entropy–expression relation and of the contamination of each GCG. pysccdc will continue to follow scCDC releases, with each version pinned to the release it reproduces.
Data and code availability
pysccdc is released under the Apache License 2.0 on PyPI (pip install pysccdc) and at https://github.com/omicverse/py-sccdc; this report describes version 0.1.1. The benchmark (report/scripts in the repository) reproduces every number and figure in this report. The filtered and raw matrices of the 10x Genomics datasets hgmm_1k_v3, hgmm_5k_v3, hgmm_10k_v3, hgmm_6k and hgmm_12k were obtained from https://www.10xgenomics.com/datasets, accessed on 11 November 2026. Software: pysccdc 0.1.1 (Python 3.10, NumPy 2.2.6, SciPy 1.15.2, pandas 2.3.3; scanpy 1.11.5 for the clustering and Fig. 1f–i); scCDC 1.4 with Seurat 5.5.1 and pROC 1.19.1 on R 4.5.3. Hardware: one node of the Stanford Sherlock cluster (AMD EPYC 9754).
Declaration of generative AI and AI-assisted technologies
The authors used Claude Opus 5.5, GPT-6 Astra, and OmicOS to proofread grammar and syntax, improve readability. Any AI-assisted edits were reviewed by the authors, who take full responsibility for the content of this publication.
Conflicts of interest
Contributors Zehua Zeng and Xu Meng are affiliated with OmicVerse, Inc.
References
- 1.Heumos L, Schaar AC, Lance C, et al. (2023). Best practices for single-cell analysis across modalities. Nature Reviews Genetics 24, 550-572. 10.1038/s41576-023-00586-w
- 2.Janssen P, Kliesmete Z, Vieth B, et al. (2023). The effect of background noise and its removal on the analysis of single-cell expression data. Genome Biology 24, 140. 10.1186/s13059-023-02978-x
- 3.OmicVerse Team (2026). pysoupx: a Python implementation of SoupX for ambient RNA removal in single-cell RNA-seq data. OmicVerse Technical Reports. https://omicverse.org/articles/pysoupx.html
- 4.Yang S, Corbett SE, Koga Y, et al. (2020). Decontamination of ambient RNA in single-cell RNA-seq with DecontX. Genome Biology 21, 57. 10.1186/s13059-020-1950-6
- 5.Fleming SJ, Chaffin MD, Arduini A, et al. (2023). Unsupervised removal of systematic background noise from droplet-based single-cell experiments using CellBender. Nature Methods 20, 1323-1335. 10.1038/s41592-023-01943-7
- 6.Berg M, Petoukhov I, van den Ende I, et al. (2023). FastCAR: fast correction for ambient RNA to facilitate differential gene expression analysis in single-cell RNA-sequencing datasets. BMC Genomics 24, 722. 10.1186/s12864-023-09822-3
- 7.Wang W, Cen Y, Lu Z, et al. (2024). scCDC: a computational method for gene-specific contamination detection and correction in single-cell and single-nucleus RNA-seq data. Genome Biology 25, 136. 10.1186/s13059-024-03284-w
- 8.Wolf FA, Angerer P, Theis FJ (2018). SCANPY: large-scale single-cell gene expression data analysis. Genome Biology 19, 15. 10.1186/s13059-017-1382-0
- 9.Virshup I, Bredikhin D, Heumos L, et al. (2023). The scverse project provides a computational ecosystem for single-cell omics data analysis. Nature Biotechnology 41, 604-606. 10.1038/s41587-023-01733-8
- 10.Zeng Z, Ma Y, Hu L, et al. (2024). OmicVerse: a framework for bridging and deepening insights across bulk and single-cell sequencing. Nature Communications 15, 5983. 10.1038/s41467-024-50194-3
- 11.Gautier L. rpy2: Python interface to the R language. https://rpy2.github.io
- 12.Muzellec B, Teleńczuk M, Cabeli V, Andreux M (2023). PyDESeq2: a python package for bulk RNA-seq differential expression analysis. Bioinformatics 39, btad547. 10.1093/bioinformatics/btad547
- 13.Love MI, Huber W, Anders S (2014). Moderated estimation of fold change and dispersion for RNA-seq data with DESeq2. Genome Biology 15, 550. 10.1186/s13059-014-0550-8
- 14.Zeng Z, Meng X (2026). pyedger: a Python implementation of edgeR for differential expression analysis. Preprints.org. 10.20944/preprints202611.1133.v1
- 15.Robinson MD, McCarthy DJ, Smyth GK (2010). edgeR: a Bioconductor package for differential expression analysis of digital gene expression data. Bioinformatics 26, 139-140. 10.1093/bioinformatics/btp616
- 16.Shannon CE (1948). A mathematical theory of communication. Bell System Technical Journal 27, 379-423. 10.1002/j.1538-7305.1948.tb01338.x
- 17.Benjamini Y, Hochberg Y (1995). Controlling the false discovery rate: a practical and powerful approach to multiple testing. Journal of the Royal Statistical Society Series B 57, 289-300. 10.1111/j.2517-6161.1995.tb02031.x
- 18.Hao Y, Stuart T, Kowalski MH, et al. (2024). Dictionary learning for integrative, multimodal and scalable single-cell analysis. Nature Biotechnology 42, 293-304. 10.1038/s41587-023-01767-y
- 19.Robin X, Turck N, Hainard A, et al. (2011). pROC: an open-source package for R and S+ to analyze and compare ROC curves. BMC Bioinformatics 12, 77. 10.1186/1471-2105-12-77
- 20.Youden WJ (1950). Index for rating diagnostic tests. Cancer 3, 32-35. 10.1002/1097-0142(1950)3:1<32::aid-cncr2820030106>3.0.co;2-3
- 21.Virshup I, Rybakov S, Theis FJ, Angerer P, Wolf FA (2024). anndata: access and store annotated data matrices. Journal of Open Source Software 9, 4371. 10.21105/joss.04371
- 22.Harris CR, Millman KJ, van der Walt SJ, et al. (2020). Array programming with NumPy. Nature 585, 357-362. 10.1038/s41586-020-2649-2
- 23.Virtanen P, Gommers R, Oliphant TE, et al. (2020). SciPy 1.0: fundamental algorithms for scientific computing in Python. Nature Methods 17, 261-272. 10.1038/s41592-019-0686-2
- 24.McKinney W (2010). Data structures for statistical computing in Python. Proceedings of the 9th Python in Science Conference, 56-61. 10.25080/Majora-92bf1922-00a
- 25.Matsumoto M, Nishimura T (1998). Mersenne twister: a 623-dimensionally equidistributed uniform pseudo-random number generator. ACM Transactions on Modeling and Computer Simulation 8, 3-30. 10.1145/272991.272995
- 26.Cody WJ (1993). Algorithm 715: SPECFUN–a portable FORTRAN package of special function routines and test drivers. ACM Transactions on Mathematical Software 19, 22-30. 10.1145/151271.151273
- 27.Zheng GXY, Terry JM, Belgrader P, et al. (2017). Massively parallel digital transcriptional profiling of single cells. Nature Communications 8, 14049. 10.1038/ncomms14049
- 28.Becht E, McInnes L, Healy J, et al. (2019). Dimensionality reduction for visualizing single-cell data using UMAP. Nature Biotechnology 37, 38-44. 10.1038/nbt.4314
Supplementary information
Supplementary methods
Data. The tasks are those of the pysoupx benchmark3: for each mixture, Cell Ranger's cells (for the v2 datasets, the union of the cells called with the human and the mouse reference), one Leiden clustering of them computed with scanpy, and species labels (human with at least 90% of counts from human genes, mouse with at most 10%, the rest mixed). Genes with counts in fewer than three cells were removed, as CreateSeuratObject(counts, min.cells = 3) does.
Runs. In R, the clusters were set as the identities of a Seurat object, and ContaminationDetection and then ContaminationCorrection with the detected GCGs were run with default arguments. In Python, the same two functions were run on an AnnData object with the cluster column and the same defaults.
Removal. For each single-species cell, the counts of the other species' genes before and after correction give the cross-species counts removed; the counts of its own species' genes give the own-species counts removed. Per mixture, both are summed over the human and mouse cells and given as percentages of all their counts (Fig. 1a) or of the cross-species or own-species counts before correction.
Embedding (Fig. 1f–i). The cells of hgmm 12k were embedded with scanpy (counts normalised to 10,000 per cell and log-transformed, 2,000 variable genes, 30 principal components, 15 nearest neighbours) and UMAP; the embedding is for display only.
Run time. Run times are wall-clock times of detection and correction, without reading and writing files. Each run was pinned to its own idle processor core with BLAS and OpenMP limited to one thread, R and Python alternating over 10 cores of one node. Each mixture ran twice per package, and the faster run is reported.
Notes for users coming from R
- Versions. pysccdc 0.1.x tracks scCDC 1.4.
- Input. The functions take an AnnData object (cells × genes) with the counts and the name of a cluster column; clusters are taken in the order of the categories, as R takes the factor levels.
- Seed. scCDC's result does not depend on
set.seed, because Seurat'ssubsetsets the seed to 1;random_state=1, the default, gives the same result, and other values give other bootstrap draws. - Genes. Filter genes detected in few cells before detection; when most genes of a cluster have no counts, the spline cannot be fitted, in R and in Python.
Author information
Affiliations
- 1 Department of Genetics, Stanford University, Stanford, CA 94305, USA
- 2 OmicVerse, Inc., San Francisco, CA 94114, USA
- 3 Hubei Key Laboratory of Agricultural Bioinformatics, College of Informatics, Huazhong Agricultural University, Wuhan 430070, China
Correspondence
Correspondence to OmicVerse Team (contact@omicos.cn).
Contributors
OmicVerse Team members who contributed to this report: Zehua Zeng1,2, Xu Meng2,3.
Cite this article
OmicVerse Team. pysccdc: a Python implementation of scCDC for gene-specific ambient RNA correction in single-cell RNA-seq data. OmicVerse Technical Reports (2026). https://omicverse.org/articles/pysccdc
@techreport{omicverseteam2026pysccdc,
  title       = {pysccdc: a Python implementation of scCDC for gene-specific ambient RNA correction in single-cell RNA-seq data},
  author      = {{OmicVerse Team}},
  institution = {OmicVerse},
  type        = {Technical Report},
  year        = {2026},
  url         = {https://omicverse.org/articles/pysccdc}
}